by Alex Kim, Consultant at TripleTen
Twitter | LinkedIn
What you'll learn in this post
Do you want to learn how to build beautiful and interactive web apps with zero web development experience?
In this post, we'll provide step-by-step instructions on how to:
- Quickly build an interactive web application using Streamlit
- Deploy this web application to the cloud using Heroku, so that it's accessible to everyone
In the first two sections, we'll discuss why we think you, as a data scientist, should learn a few things about web development and deployment, and we'll do a quick overview of available web frameworks and cloud providers.
If you want to skip the prose, feel free to jump right into the tutorial part, starting with the "Project description and setup" section.
Why is being familiar with web development important for a data scientist?
As a data scientist, you'll be expected to conduct sophisticated statistical analyses and build advanced machine learning models. However, this work will always be a part of a bigger project that involves multiple stakeholders, many of whom won't have the technical skills, time, or desire to dive deep into your code and the nuances of your work. So now the question is: how do you effectively communicate the results of your work and sell your ideas to the broader team? That's where web applications come in — an interactive format for communicating the results of your work to other users or project stakeholders.
Additionally, web applications make an excellent addition to your project portfolio, significantly improving your chances of getting hired.
Until recently, to create even a simple web application, you had to learn a whole slew of web technologies such as HTML, JavaScript, CSS and relational databases. On top of that, you had to learn Linux administration, networking, security, etc.
In the last few years, there's been a rise in web application frameworks explicitly designed for data professionals. These frameworks allow you to quickly build interactive data-centric web applications with zero web development knowledge.
And on the deployment side, there are quite a few platforms that take care of all the system administration tasks, allowing you to focus on your application.
Overview of web frameworks and cloud platforms
There are several Python-based web frameworks that are well-suited for data science applications.
The most popular ones are:
- Flask - a general-purpose micro web framework
- Dash - a framework built on top of Flask, Plotly, and ReactJS
- Voila - an extension to Jupyter that allows you to convert a Jupyter notebook into an interactive dashboard
- Streamlit - a dashboarding framework built on top of Tornado. (This is the one we'll be focusing on.)
%2520(1).webp)
IaaS vs. PaaS
Now let's quickly discuss the differences between the two types of cloud services: Infrastructure as a Service (IaaS) and Platform as a Service (PaaS).
PaaS delivers a platform for developers that they can build upon and use to create customized applications. All servers, storage, and networking are managed by the provider.
IaaS delivers cloud computing infrastructure, including servers, networks, operating systems, and storage, through virtualization technology.
The table below summarizes the differences between IaaS and PaaS services and lists some examples of cloud vendors.
.webp)
Project description and setup
In this project, we'll build a simple application to explore some properties of a used car dataset (available here). You can see the final result in the video below.
We'll be using pipenv to manage the virtual environment for this project, so make sure to install it into your development environment. Once that's done, we'll need to perform the following steps:
- Create a GitHub repository
- Clone the repository locally
- Run the following commands inside the repository directory:
- Download the dataset into the repository folder
At this stage, your repository folder should contain the following files: Pipfile, Pipfile.lock, vehicles_us.csv, and some other optional files like README.md, .gitignore, LICENSE, etc. depending on what options you selected when creating your repository.
Building and testing our web application
All the code for our application will be contained in one file: app.py.
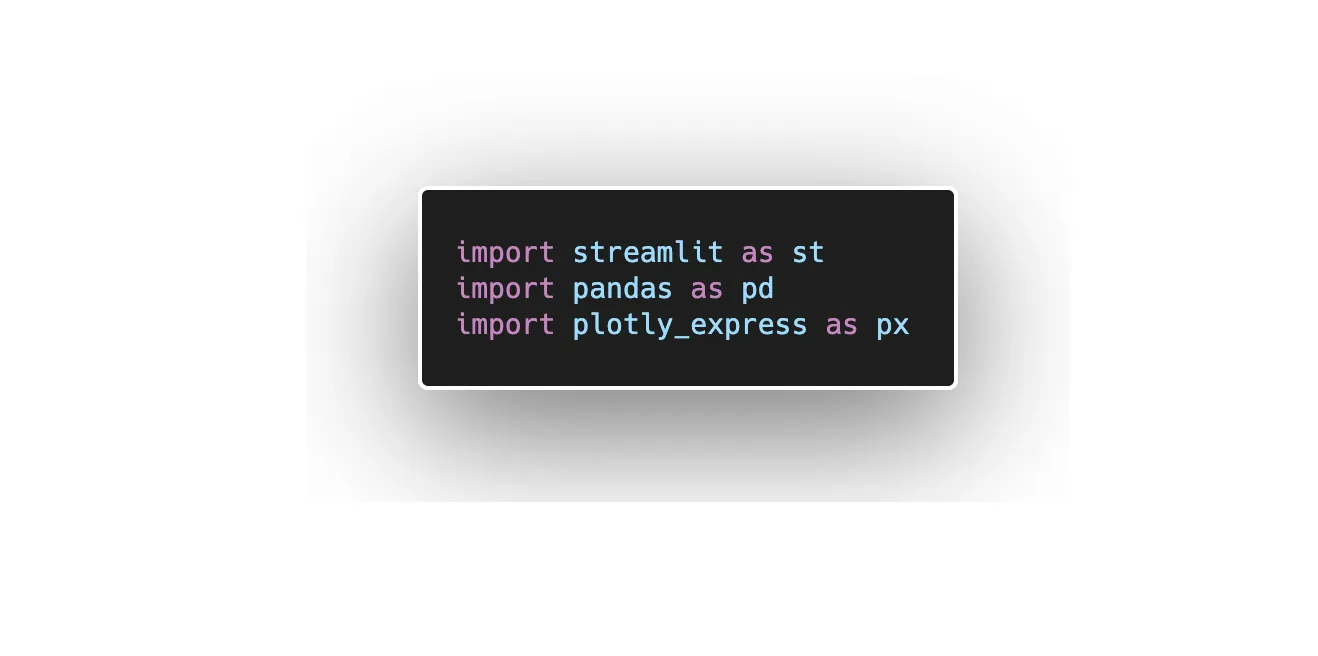
First, let's import all the libraries we installed earlier:

Next, we load our data and create a new column manufacturer by getting the first word from the model column:
Data viewer
Now we can display our DataFrame with Streamlit by simply writing:
Vehicle types by manufacturer
To see the distribution of vehicle types by the manufacturer (e.g. how many Ford sedans vs. trucks are in this dataset), we can create a simple Plotly histogram and display it with Streamlit like this:
Histogram of condition vs. model_year
Similarly, if we wanted to explore the relationship between condition and model_year, we'd use the following:
Compare price distribution between manufacturers
Let's say we want to look into price distribution between a pair of manufacturers.
First, we'd need to get the user's input for the first and second manufacturer's names, then filter our DataFrame to contain only these two manufacturers.
Then we can create a Plotly histogram with a few parameters:
That's it. With these few lines of code, we've built a simple but perfectly functional application.
You can find the complete app.py file here. We hope that you get the main idea and that later you'll be able to make your applications as sophisticated as you want them to be.
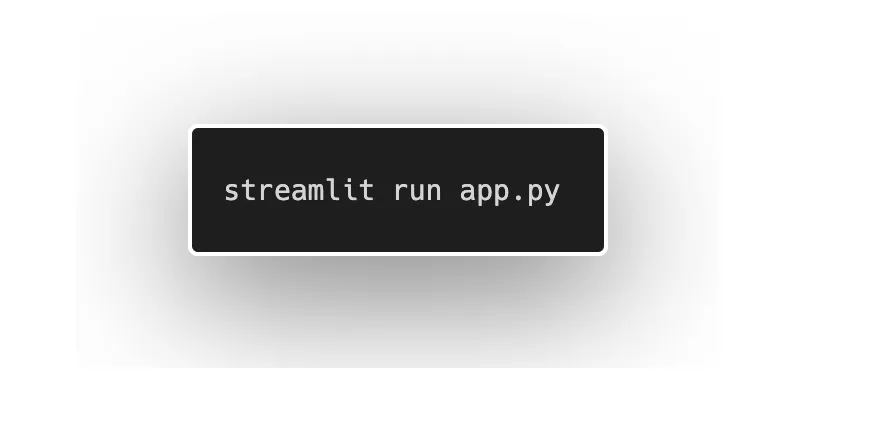
Let's quickly test the application by running it locally first.
In your terminal, type the following command:

It will start a Streamlit web server that you can access in your browser at http://localhost:8501/
If there's anything that you want to fix/add to your application, edit the app.py file and refresh the browser to see the changes.
If you are satisfied with the local version of the application, let's commit our edits back to GitHub:
Deploying our application
Now it's time to deploy our application to the cloud:
- Add a file named Procfile to the root of your repository (i.e. in the same directory with other files like Pipfile and Pipfile.lock)
- Write the following line to Procfile:web:
streamlit run --server.enableCORS false --server.port $PORT
This tells Heroku what kind of application we'll be running (i.e. web), and what specific command to run when launching your application for the first time. - Create an account on heroku.com and install heroku cli
- Create a new app and give it a name
.webp)
- Add heroku repository:
- Deploy to Heroku:
This last command pushes your code to Heroku and triggers the provisioning of resources (i.e. a small virtual machine that will host our application). It also takes care of installing all required Python libraries. Heroku automatically detects Pipfile and Pipfile.lock , and will install everything we put there.
.webp)
Finally, after a couple of minutes, you'll see the URL of your deployed application. It'll look like this:
Visit this URL to make sure everything is working as expected.
Wrap up
Congratulations! Feel free to add this URL to your portfolio and share it with your friends and family.
Streamlit is an excellent framework for those getting started with web development, and we've only scratched the surface of what it can do. Visit Streamlit's application gallery to see more incredible examples of what's possible to build with it.
We hope to have convinced you that adding skills like web development to your toolkit is a worthwhile and enjoyable way to boost your chances of landing a data scientist job or getting ahead in your current role.


.webp)
%20(1).jpg)


